How to Build a Google Search Console Dashboard in Looker Studio
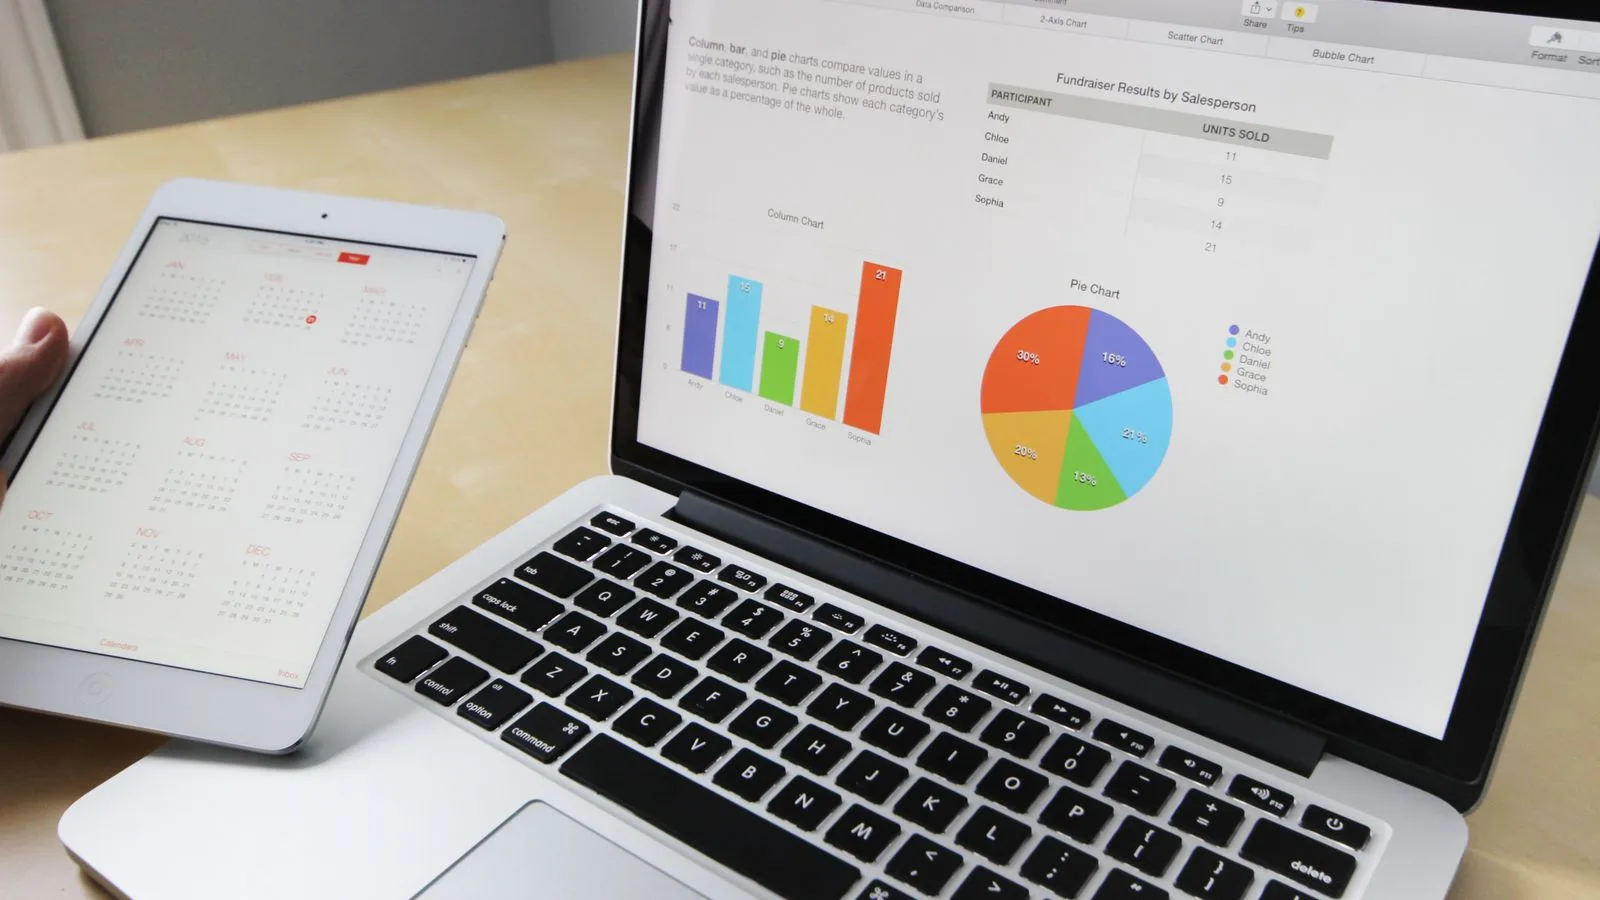
To build a Google Search Console dashboard in Looker Studio, connect the verified Search Console property twice: once as a Site Impression data source for query-level reporting and once as a URL Impression source for landing-page reporting. Then add scorecards for clicks, impressions, CTR, and average position, followed by time-series charts and filtered tables for queries and pages.
This setup creates a reusable SEO dashboard without manually exporting spreadsheets. It also avoids a common mistake: trying to combine site-level and page-level Search Console aggregation in one connector.
What you need before you start
You need a Google Search Console property with data and a Google account that has at least view permission. Sign in to Looker Studio with the same Google account that can access the property.
If the property does not appear in the connector, mismatched accounts or insufficient Search Console permission are the first things to check. Google documents this requirement in its updated Search Console connector guide.
You do not need Looker Studio Pro for the basic dashboard described here. The standard Search Console connector and core report controls are sufficient.
Choose the right Search Console table
The Looker Studio connector offers two table types. Your choice controls how Google aggregates impressions and which dimensions are available.
Site Impression
Use Site Impression when the main question concerns the whole property, search queries, countries, or devices. It is the better source for a query-performance page because it uses property-level aggregation.
URL Impression
Use URL Impression when you need landing pages, page-level CTR, search appearance, Discover, or Google News reporting. It provides URL-level aggregation and the dimensions needed to evaluate individual pages.
A single Search Console data source can use only one of these tables. To show both views in one dashboard, create two data sources and add both to the report. Do not blend them merely to force totals to match: site and URL impressions use different aggregation methods, so small differences can be legitimate.
How to connect Google Search Console to Looker Studio
1. Create the Site Impression source
- Open Looker Studio.
- Select Create, then Data source.
- Choose the Search Console connector.
- Authorize access if Google asks.
- Select the correct Search Console property.
- Choose Site Impression.
- Select the default search type, normally Web for a standard SEO dashboard.
- Click Connect.
Rename the source immediately to something unambiguous, such as GSC — Site Impression. Clear names prevent editors from accidentally assigning the wrong source to a chart later.
2. Create the URL Impression source
Repeat the connection process, choose the same property, and select URL Impression. Name this source GSC — URL Impression.
The URL source supports Web, Image, Video, News, Discover, and Google News search types. Site Impression supports Web, Image, Video, and News. If your dashboard will cover multiple surfaces, add a Search type control instead of creating a separate report for each one.
3. Add both sources to one report
Create a blank report from either source, then open Resource → Manage added data sources and add the second source. When you create each chart, check the selected data source in the Setup panel.
This is the most important quality-control step. Query charts should usually use Site Impression, while landing-page charts should use URL Impression.
Build the SEO overview page
The overview should answer three questions quickly: Is organic visibility growing, are searchers clicking, and which parts of the site changed?
Add four scorecards
Create scorecards for:
- Clicks — visits from Google Search results as counted by Search Console.
- Impressions — how often a result from the property appeared.
- Site CTR — clicks divided by impressions.
- Average Position — the average position of the topmost result represented by the selected aggregation.
Apply one consistent default date range to all four. Turn on comparison with the previous period or previous year when that comparison fits the site’s seasonality.
Average position is not a simple rank tracker. Search results vary by query, place, device, time, and user context. Treat it as a directional metric and investigate changes by query and page rather than assuming every user saw the same ranking.
Add a search-performance time series
Create a time-series chart with Date as the dimension and Clicks plus Impressions as metrics. A dual-axis chart can make both lines visible when their scales differ greatly, but label each axis clearly.
Use daily granularity for short investigations and weekly or monthly granularity for longer-term reporting. Google notes that broader time intervals can smooth routine weekend and holiday fluctuations.
Add device and country breakdowns
Add a table or bar chart for Device and another for Country. Use Clicks, Impressions, CTR, and Average Position as the metrics.
These breakdowns help reveal cases where overall performance hides a narrower issue. A mobile CTR decline, for example, may deserve a title or page-experience review even if desktop results remain stable.
Create a query-opportunities page
Use the Site Impression source for this page.
Add a query table
Set Query as the dimension and include:
- Clicks
- Impressions
- Site CTR
- Average Position
Sort by Impressions to find queries with visibility, then look for meaningful phrases with lower-than-expected CTR. Do not judge CTR without considering intent, position, SERP features, and whether the page title answers the query.
Add useful filters
Create controls for date, country, device, and search type. You can also add a text filter for Query so an editor can inspect a topic cluster or brand term.
A practical opportunity view is a filtered table that excludes branded terms and keeps queries with enough impressions to make the comparison meaningful. Avoid hard-coding a universal impression threshold; a useful minimum depends on the size and seasonality of the site.
Use the query patterns to inform research, then compare them with the workflow in our guide to finding content ideas with Google Trends and Gemini. Search Console shows demand already connected to your site, while Trends provides broader relative interest.
Create a landing-page performance page
Use the URL Impression source for page-level charts.
Add a landing-page table
Choose Landing Page or the connector’s URL field as the dimension, then add Clicks, Impressions, URL CTR, and Average Position. Sort by Clicks for top performers or by Impressions to find visible pages that may need improvement.
Add a search box or filter control for the page URL. This lets editors isolate a directory such as /blog/, a product section, or a country folder.
Create a page trend chart
Add a time series using Date and Clicks, then connect a landing-page filter to it. Editors can select a URL in the table and see whether the change was sudden, gradual, recurring, or seasonal.
A sharp drop limited to one URL suggests a page-specific problem. A sitewide fall across devices and countries may point to a broader technical change, tracking delay, algorithmic shift, or demand change.
If affected URLs show redirect or indexing problems, use the checks in our guides to fixing Search Console redirect errors after a migration and resolving Crawled—currently not indexed.
Add a Search type control
The Search Console connector includes a Search type parameter. To let viewers switch surfaces:
- Edit the report.
- Select Add a control.
- Choose a drop-down list.
- Set the control field to Search type.
Keep the supported table types in mind. Discover and Google News are available through URL Impression, so a control connected to the Site Impression source will not expose those choices.
Set data credentials carefully
Looker Studio offers different credential modes. With owner’s credentials, authorized viewers may see report data without having direct access to the underlying Search Console property. With viewer’s credentials, each viewer must authenticate and have their own access.
Choose the option that matches your organization’s data policy. Before sharing an owner-credential report broadly, test it with a non-editor account and confirm that the filters, downloadable tables, and page URLs do not reveal information to unintended viewers.
Why blank queries appear
Search Console protects privacy by withholding some rare or sensitive queries. In Looker Studio, those records may be grouped into a row with a blank Query value.
You can create a report filter that excludes null Query values, but the visible query-table totals may then be lower than the chart totals. The difference does not necessarily indicate a broken connector.
Google’s Search performance documentation also explains that chart totals and table totals can differ because of privacy filtering and aggregation.
Common Looker Studio Search Console problems
The property does not appear
Confirm that Looker Studio and Search Console use the same Google account and that the account has view permission. If access was recently granted, sign out and back in before reconnecting.
Landing Page is missing
The chart is probably using the Site Impression source. Switch it to the URL Impression source or create that second connection.
Discover is unavailable
Discover is supported by URL Impression, not Site Impression. Check both the source table and the selected search type.
Totals do not match Search Console exactly
Verify the date range, search type, filters, time zone, and aggregation level. Site and URL sources can legitimately differ, and private queries may be hidden from tables.
CTR behaves strangely in a blended chart
CTR is a ratio. Blending or re-aggregating ratio metrics can produce errors or misleading averages. Where possible, keep native Search Console metrics in unblended charts. If a calculated CTR is necessary, calculate total clicks divided by total impressions at the intended aggregation level.
A simple monthly SEO review workflow
- Compare total clicks and impressions with the previous period and previous year.
- Check whether changes are sitewide or limited to a country, device, or search type.
- Review high-impression queries with falling CTR.
- Review landing pages with sustained losses, not one-day noise.
- Annotate migrations, redesigns, major content changes, and campaigns.
- Assign each finding an owner and a next action.
- Recheck the same segment after the change has had time to collect data.
For behavioral context after a search click, Search Console can be complemented by GA4 and session-analysis tools. Our Microsoft Clarity, Google Tag Manager, and GA4 setup guide explains how to add that layer without confusing Search performance with on-site behavior.
Bottom line
A useful Looker Studio SEO dashboard starts with two properly named Search Console sources: Site Impression for query and property analysis, and URL Impression for landing-page analysis. Build a focused overview, query page, and landing-page page; add date, device, country, and search-type controls; and document why totals can differ.
The dashboard should make investigation faster, not turn every movement into an alarm. Use it to identify durable patterns, open the affected query or page segment, and connect each finding to a verifiable SEO action.